
UX Systems Strategist & Service Design Lead with 15+ years of experience transforming complex public-sector and enterprise platforms into intuitive, accessible services.
I bridge generative and evaluative research, interaction design, and service blueprinting to de-risk delivery, improve user experiences, and streamline operations. Select a featured project from below to learn more about my process and impact.
Fixing system bottlenecks and accessibility barriers in food assistance software:
Reduced launch risks for a statewide database modernization initiative through interviewing stakeholders, identifying accessibility issues, and mapping data gaps.

Accelerating document intake flow to submit Veteran claims:
Minimized the number of screens and user steps 50% through prototyping, simplifying complex business rules, and connecting user steps to backend systems.

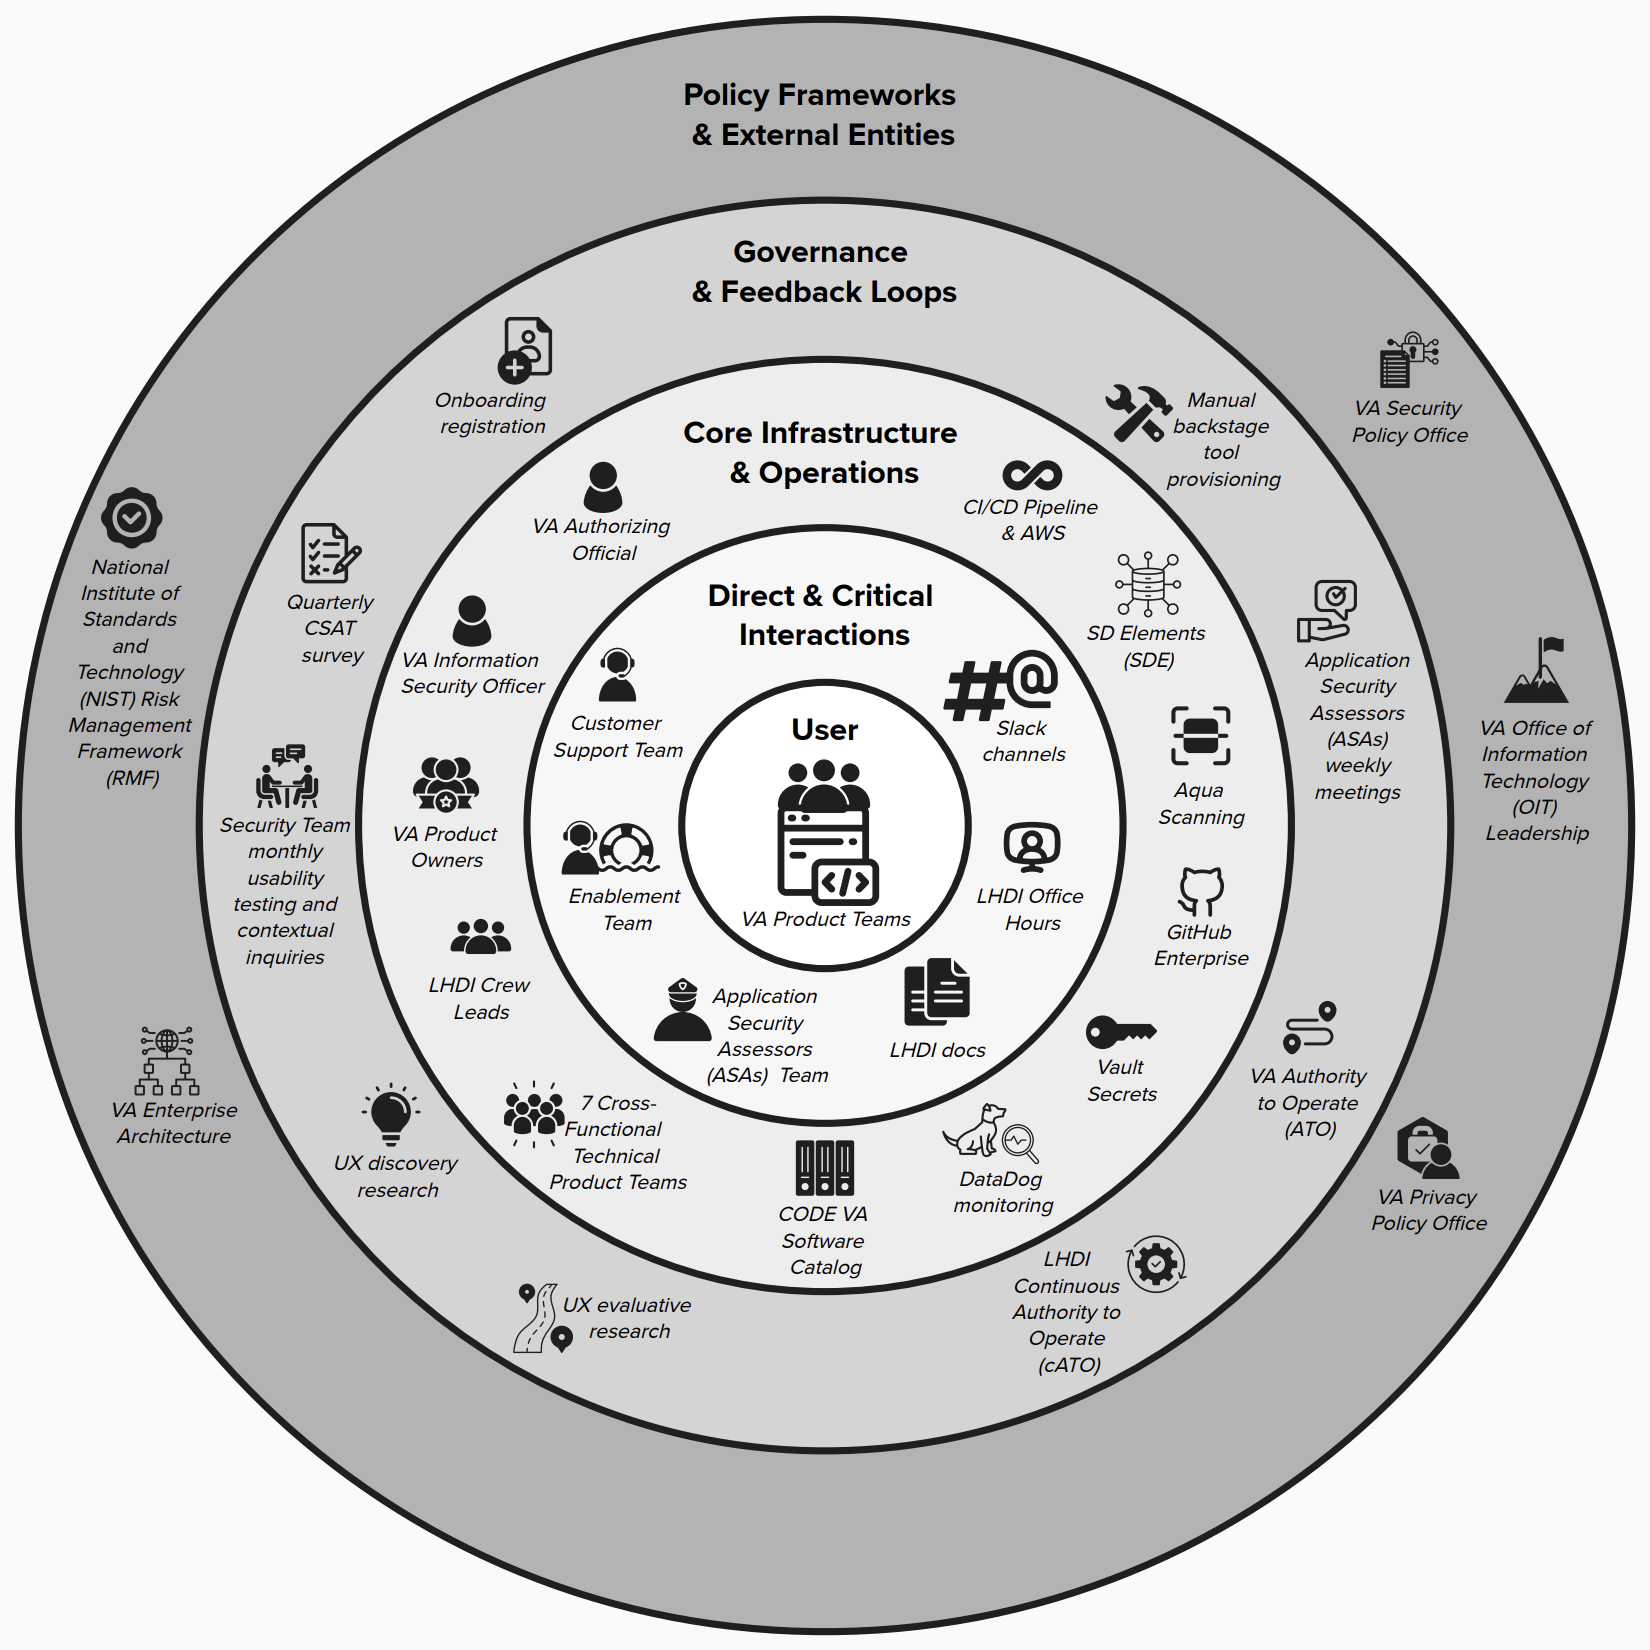
Closing critical gaps and reducing DevSecOps operational inefficiencies:
Reduced onboarding time by 32% through collaborative service design, ecosystem mapping, and service blueprinting.
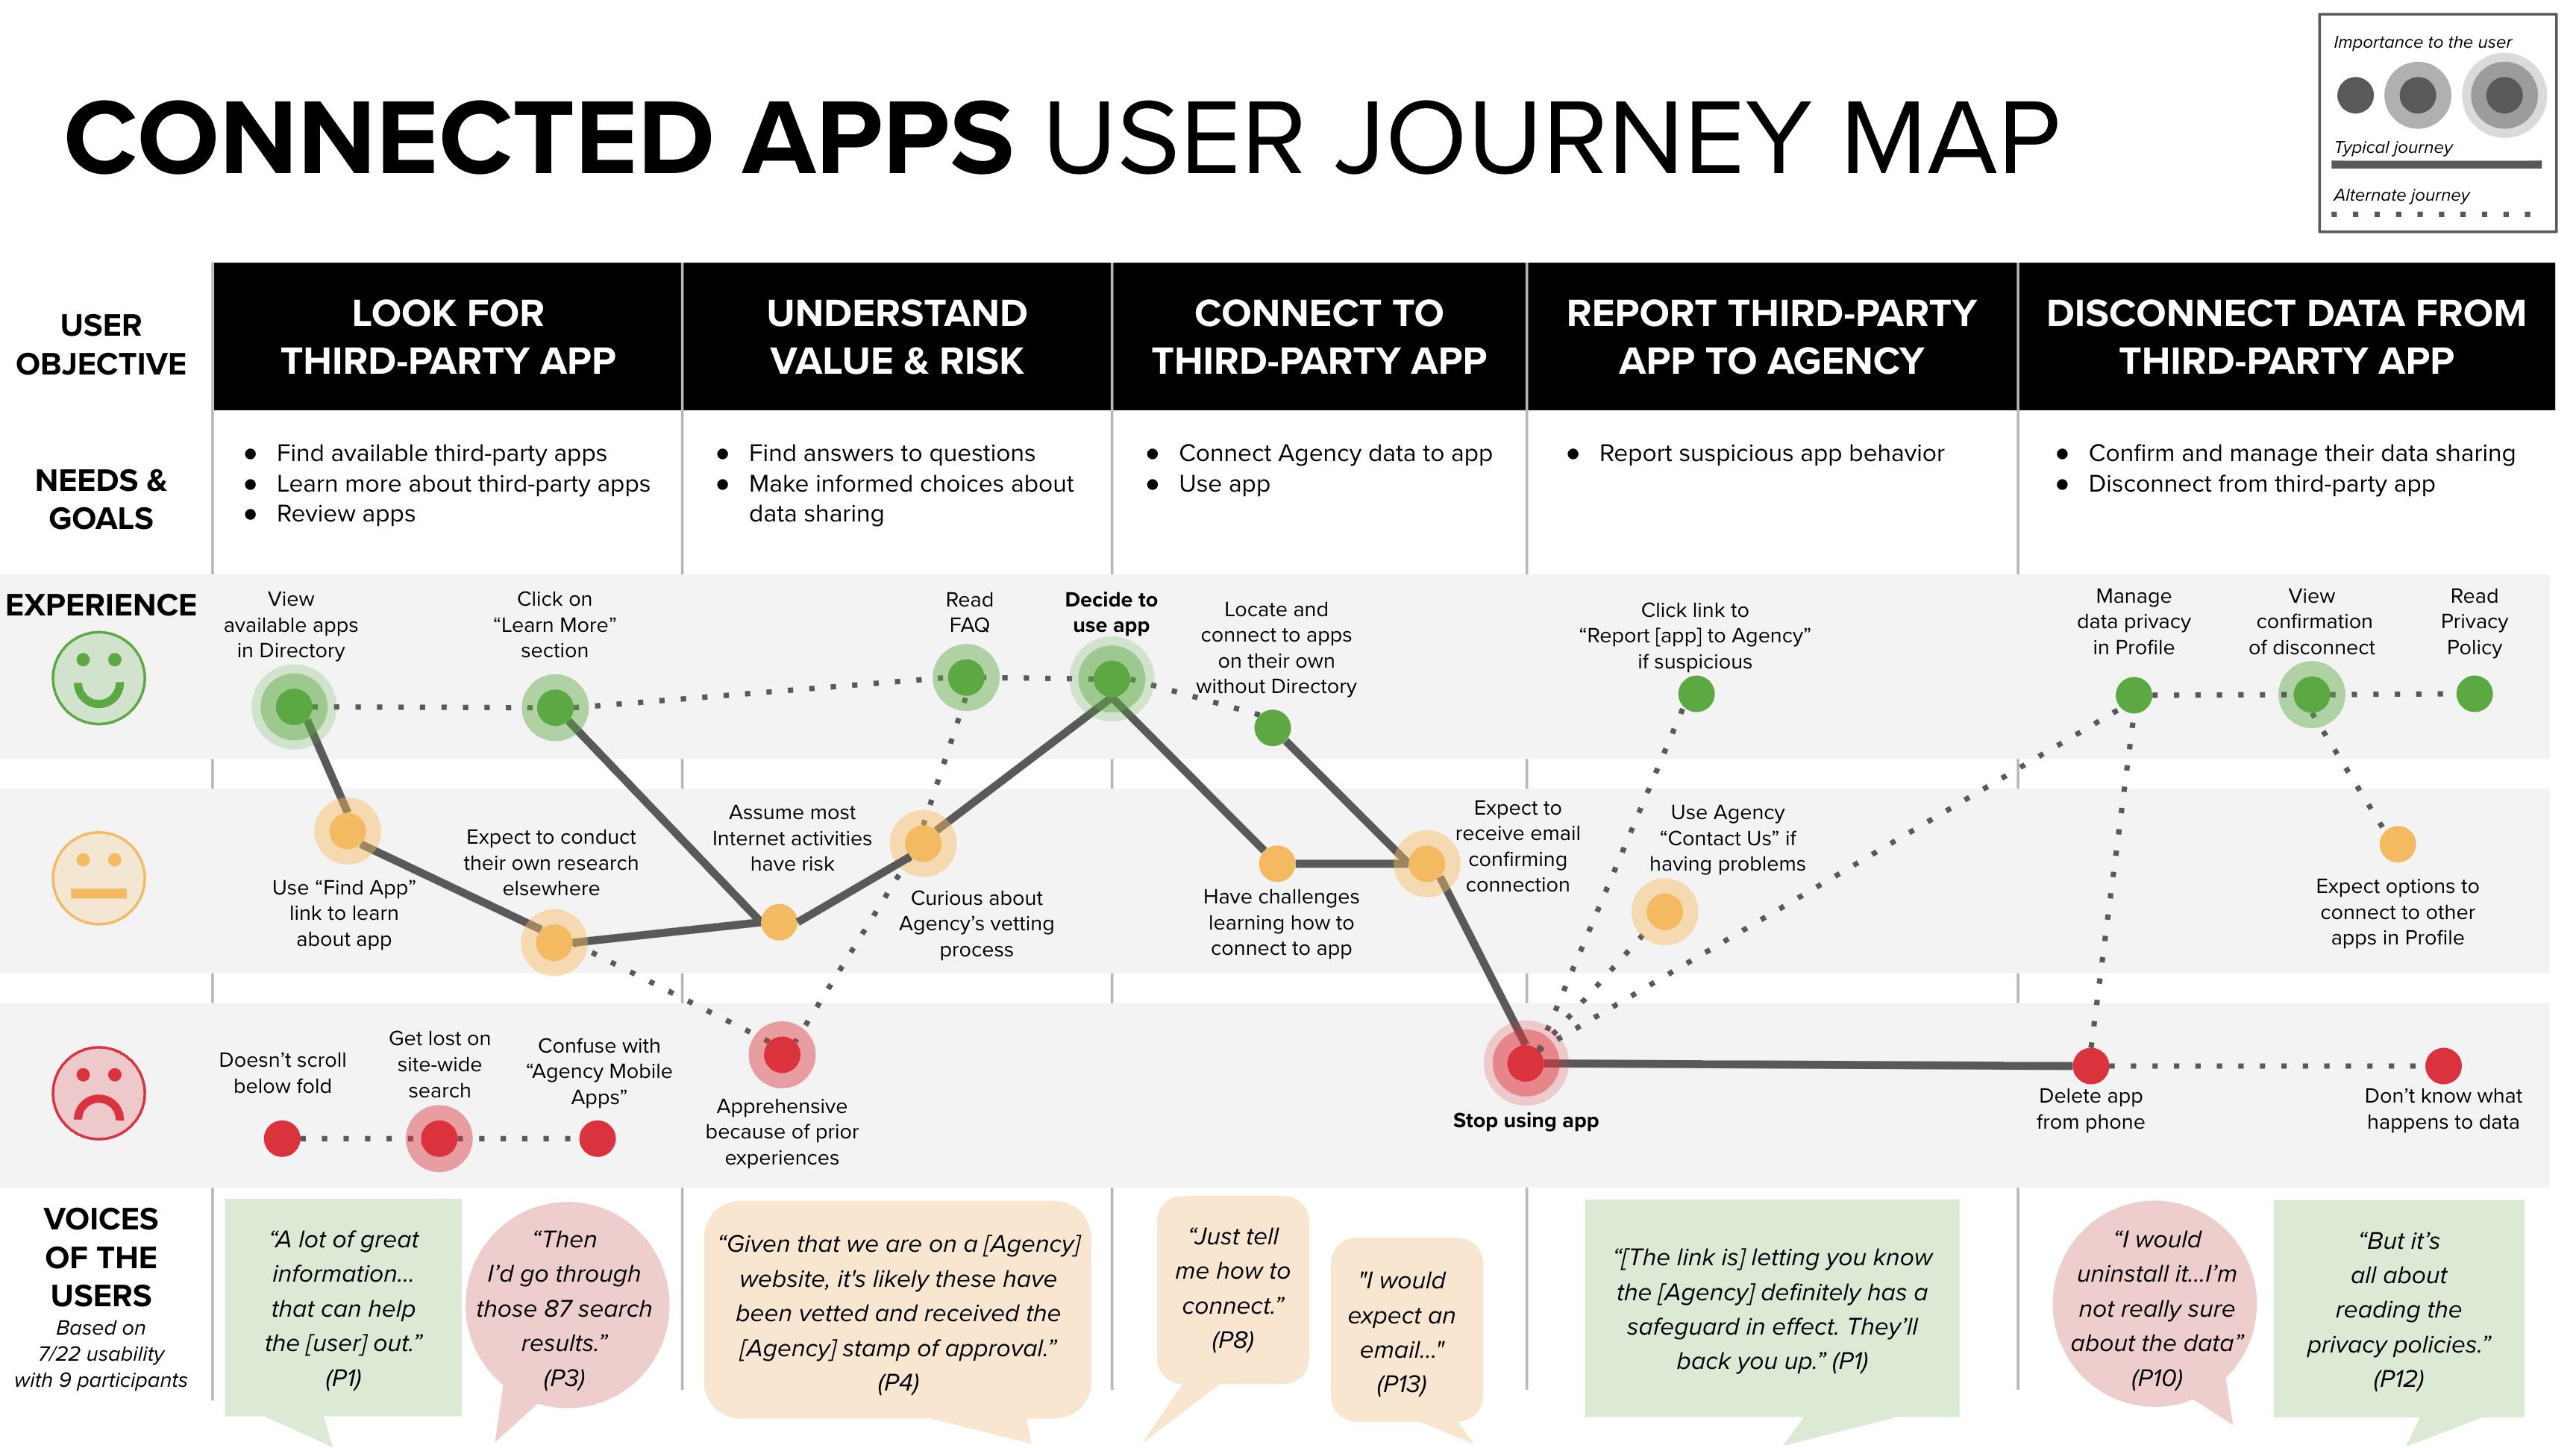
Empowering users to manage their data security:
Enhanced user security and data privacy by 363% through usability testing, journey mapping, and content design.
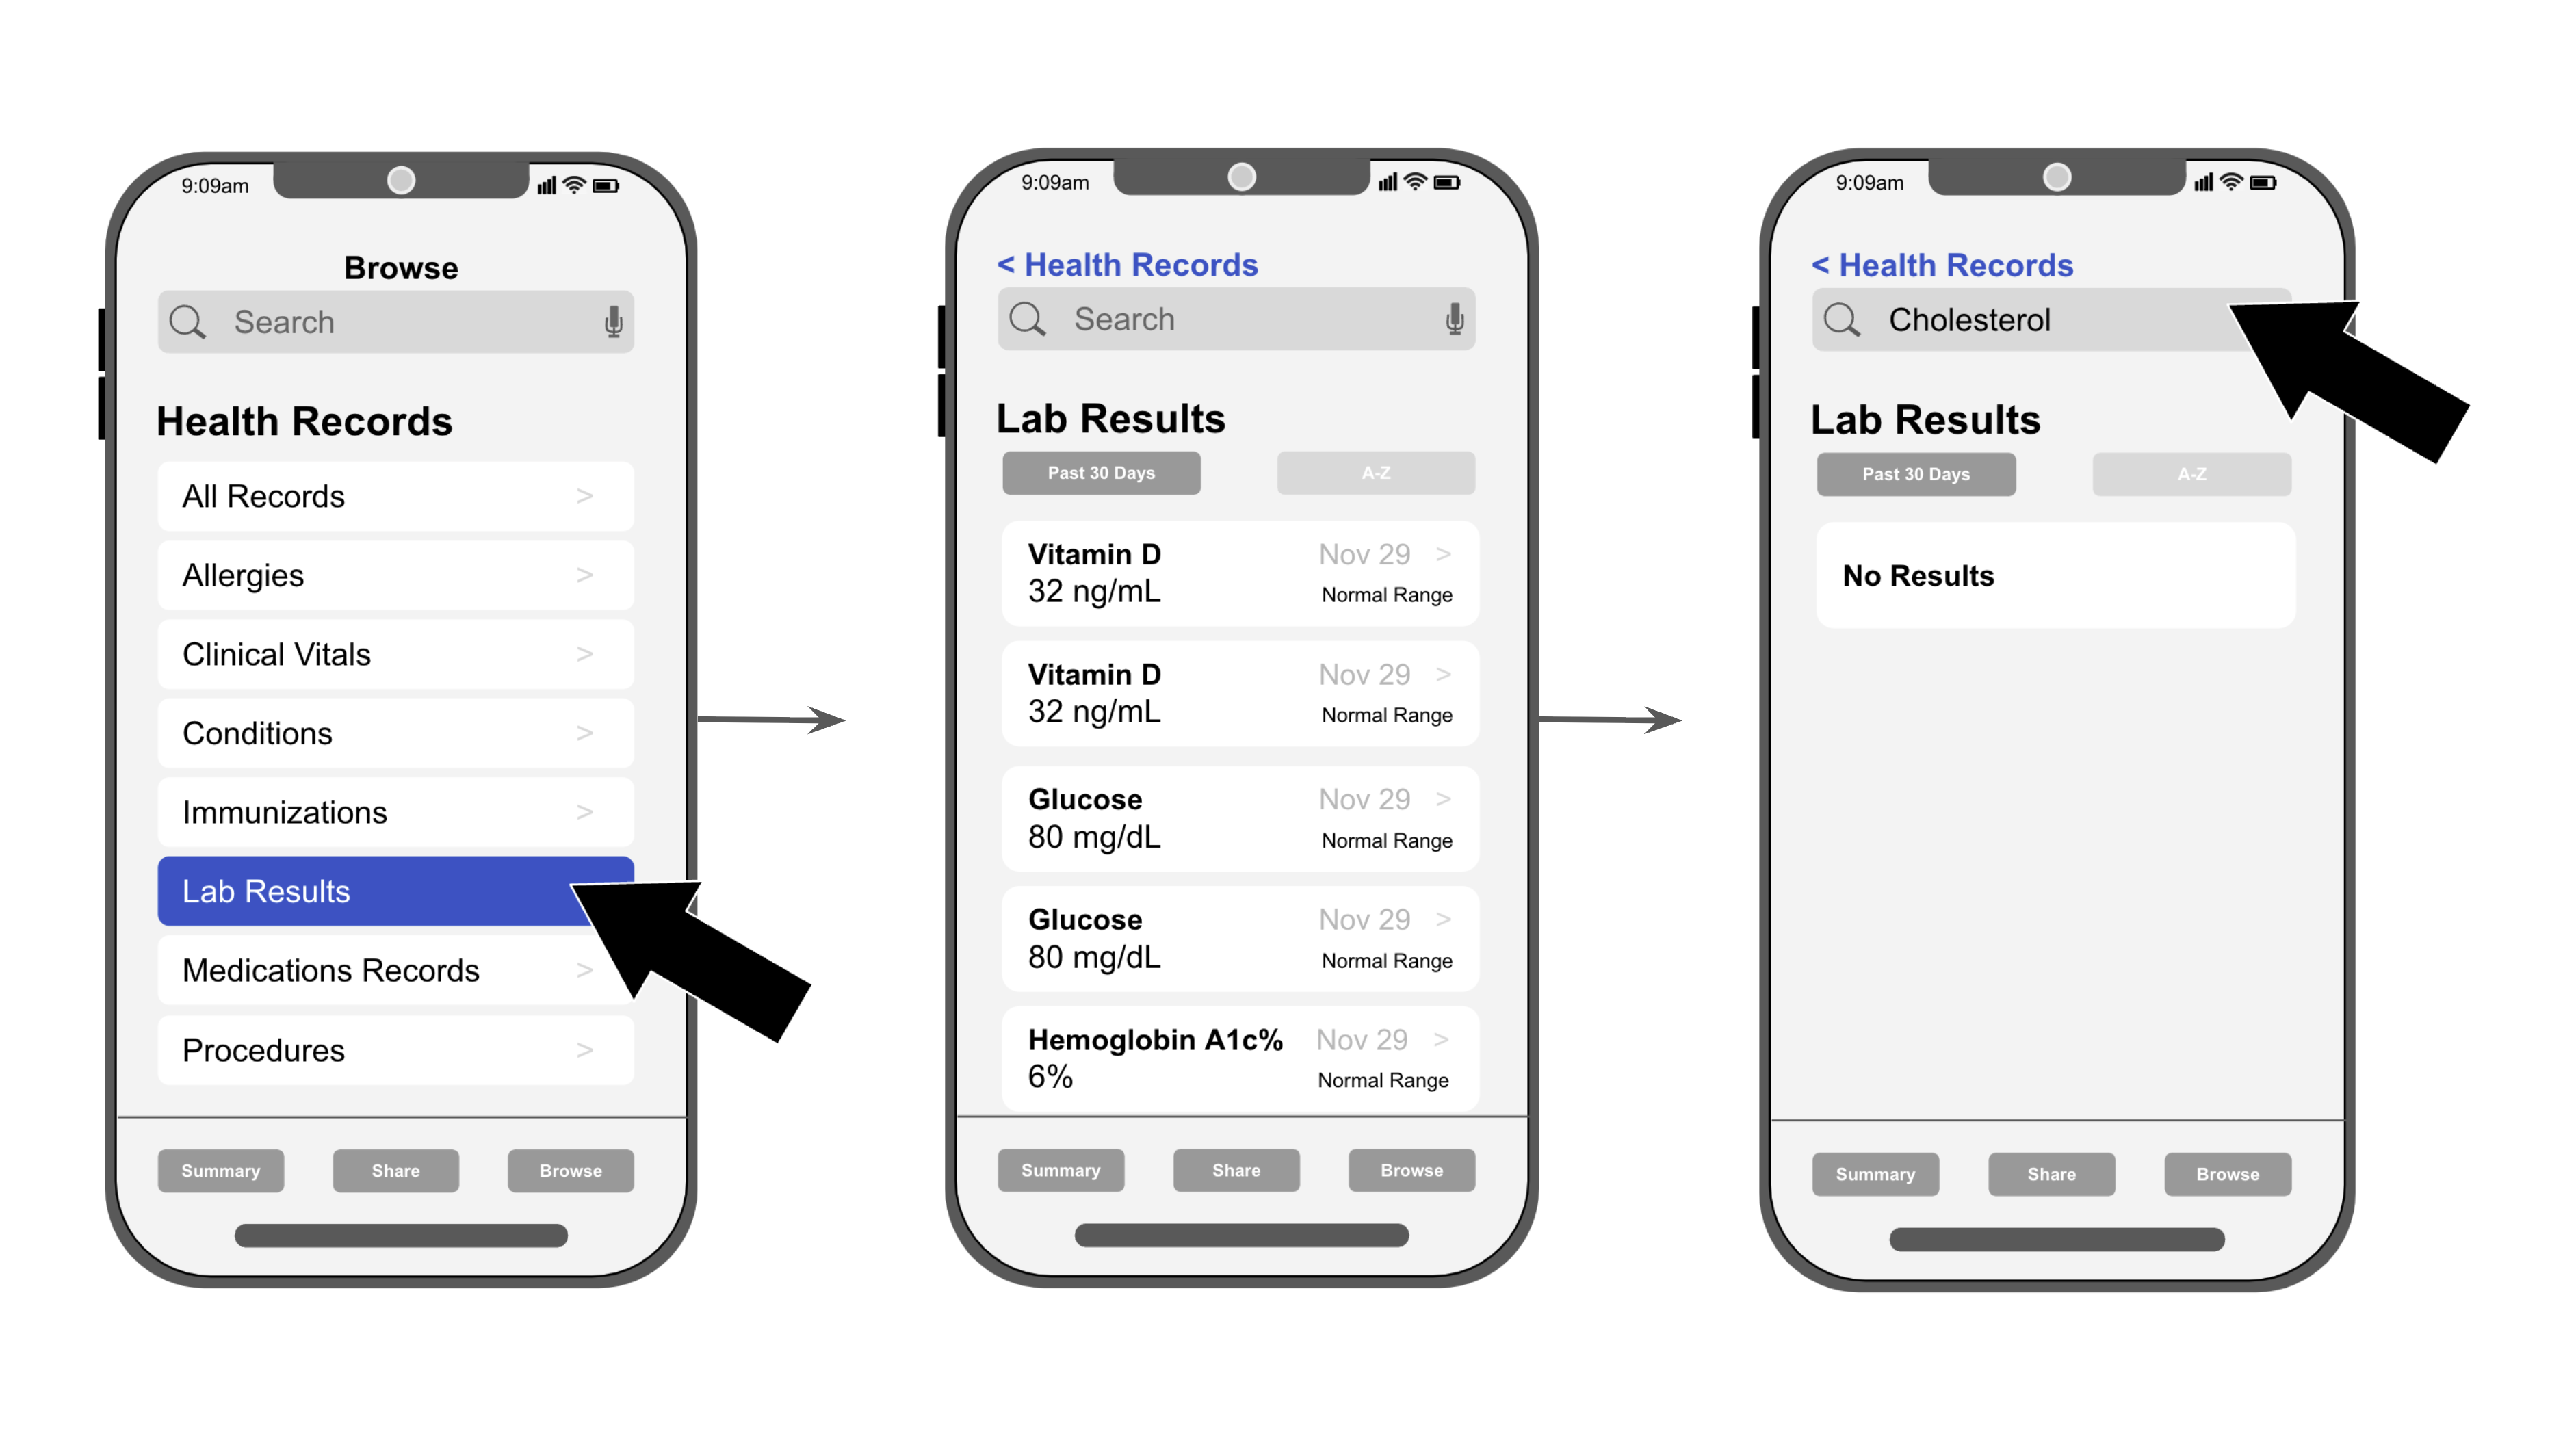
Improving the user experience with seamless API data:
Eliminated the need for costly engineering rework through concept testing two mockups.
CONTACT ME
